Query Management
Clinical Research Associates (CRAs) and Data Monitors use queries to communicate with site staff regarding data discrepancies or missing information.
Creating a Query
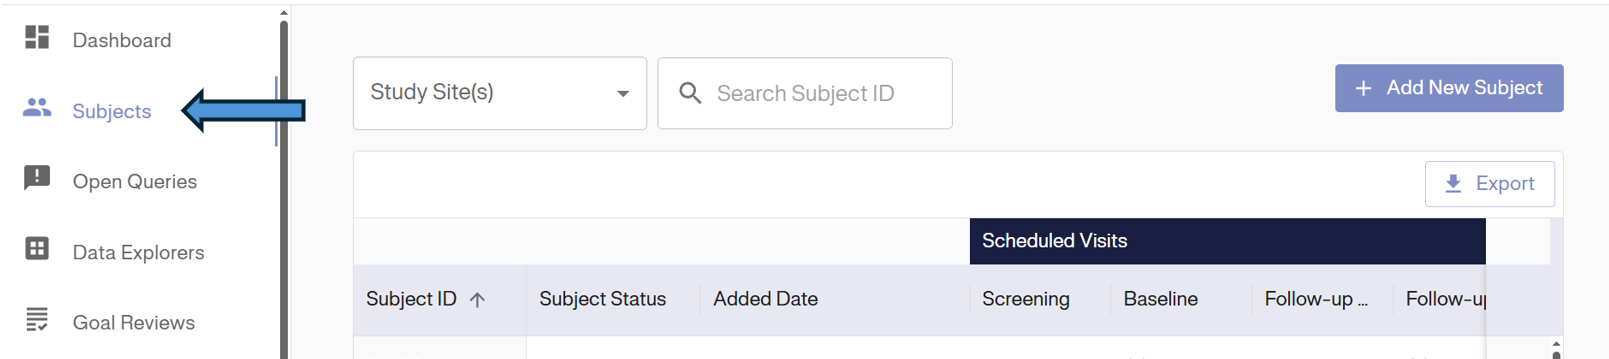
1. Navigate to Subject: From the Dashboard, click Subjects in the left sidebar.
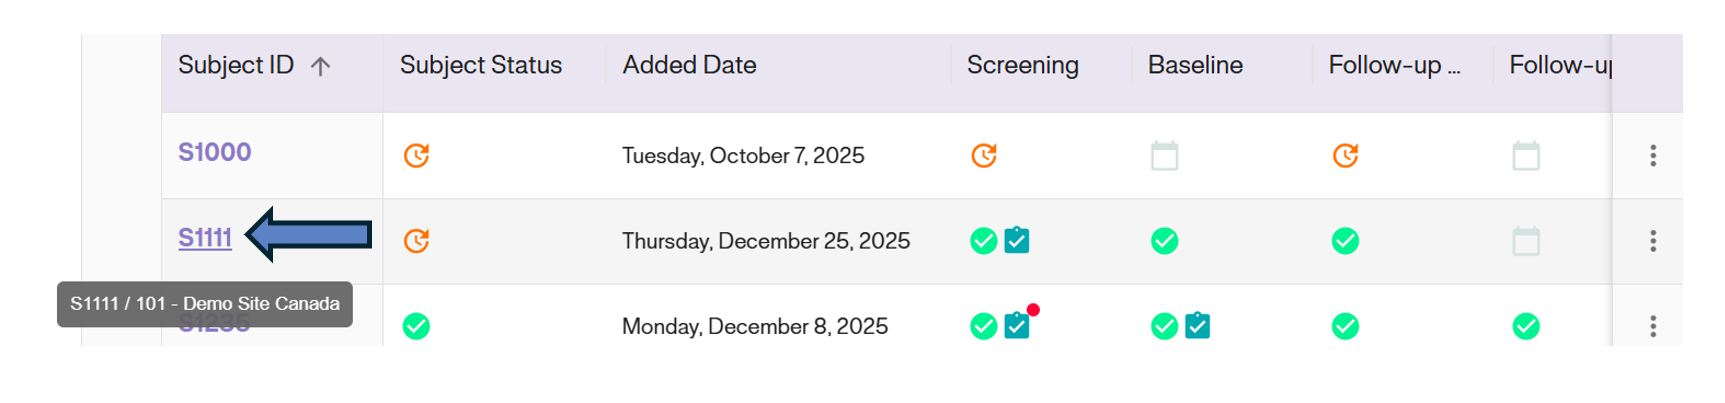
2. Select Subject: Click on the specific Subject ID from the Subject Matrix.
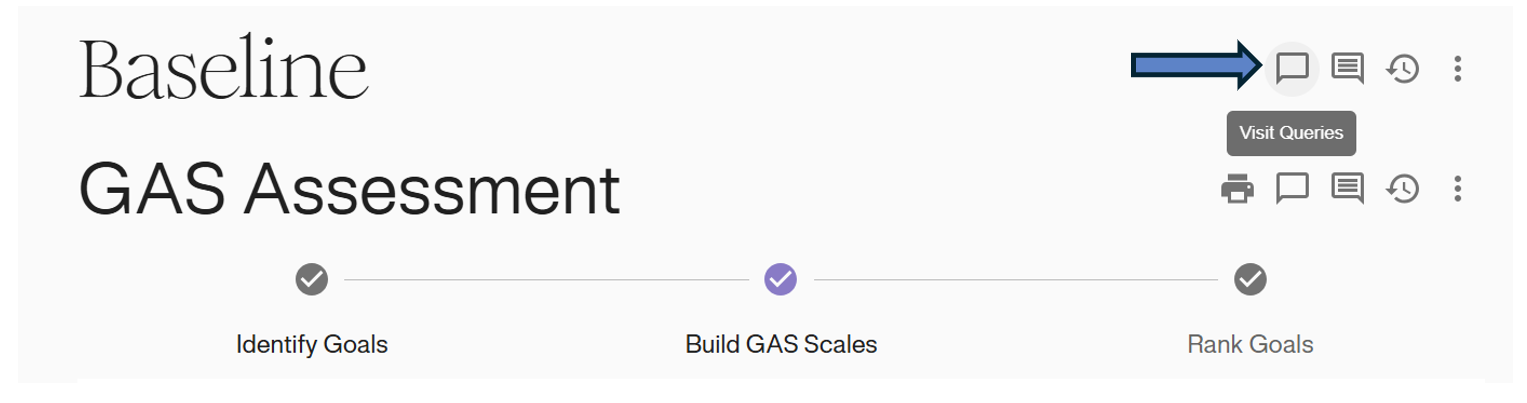
3. Open Visit: Click on the visit where the data issue exists (e.g., Baseline).
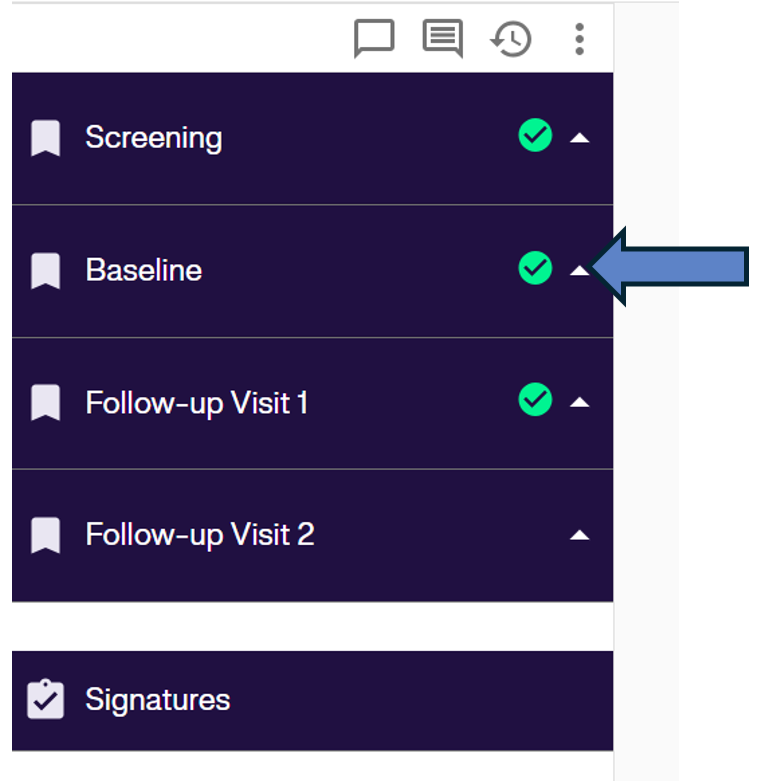
4. Open Query Dialog: Click the Dialogue Icon (chat bubble) in the top right corner of the visit header.
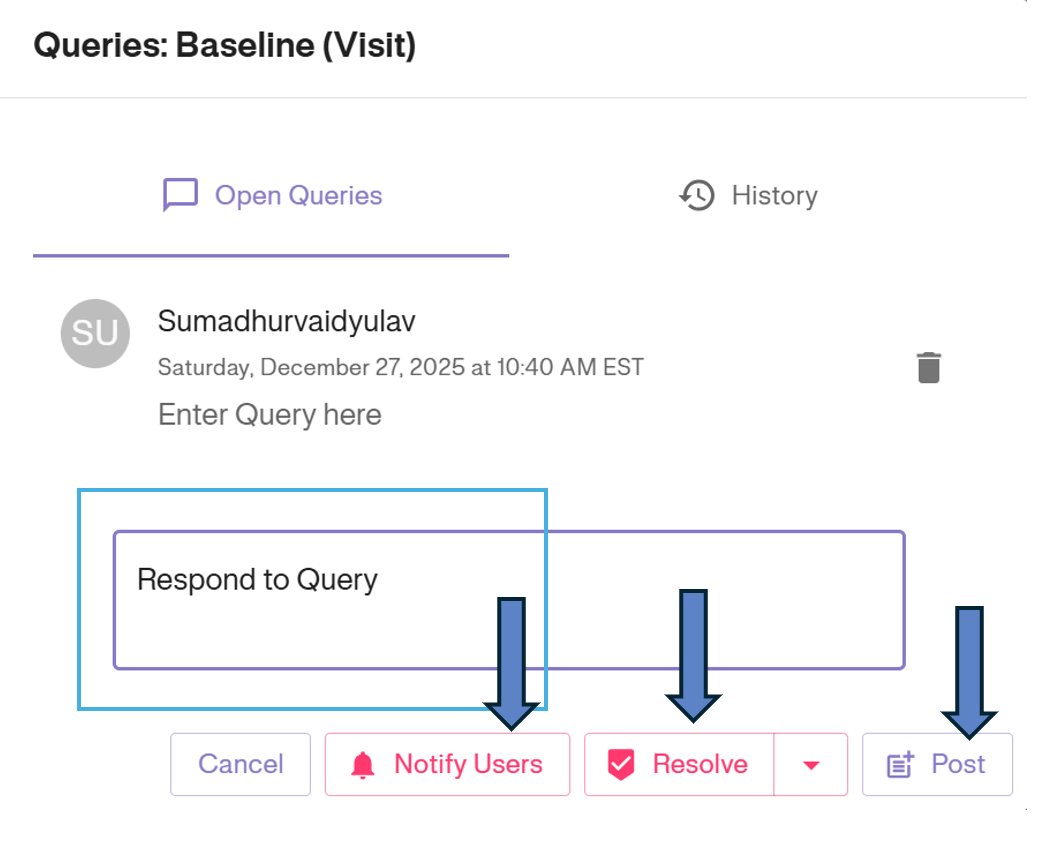
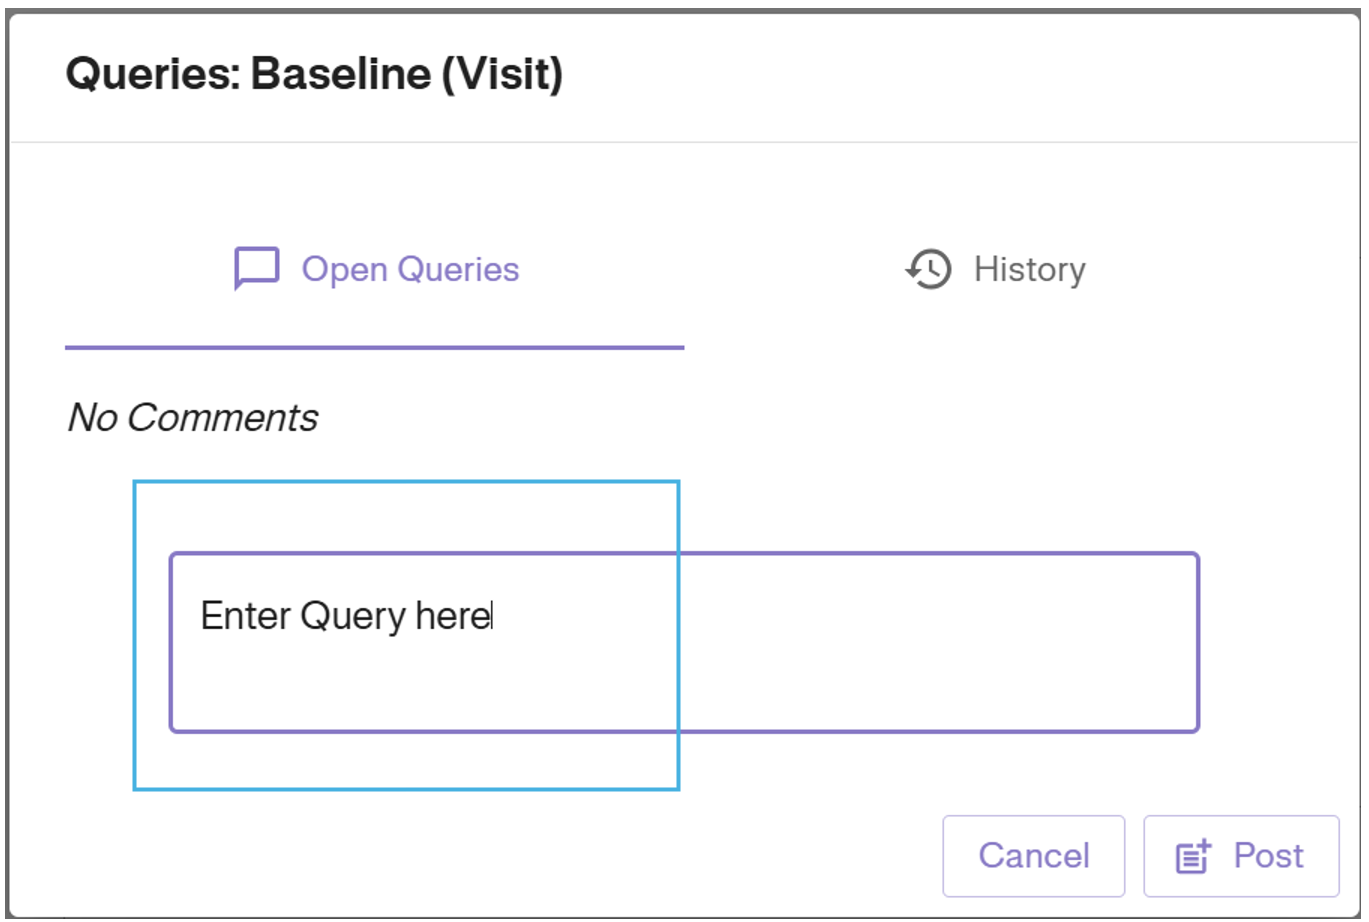
5. Enter Query: In the pop-up window, type your question or instruction in the text box.
- Click Post to save the query to the system.
6. View Query and Notify: * On clicking on the query icon again, you will be able to see your posted query.
<div style="text-align: center;">
  <img src="/assets/06-Data Monitor/Query Management/GN - Data Monitor Added new Query red dialogue box.png" alt="Red Query Indicator" />
</div>

* Click **Notify Users** if you want to send an immediate email alert to the site staff.

<div style="text-align: center;">
  <img src="/assets/06-Data Monitor/Query Management/GN - Data Monitor Opens Query pop up box.png" alt="Post and Notify" />
</div>
Tracking & Resolving Queries
Dashboard Tracking
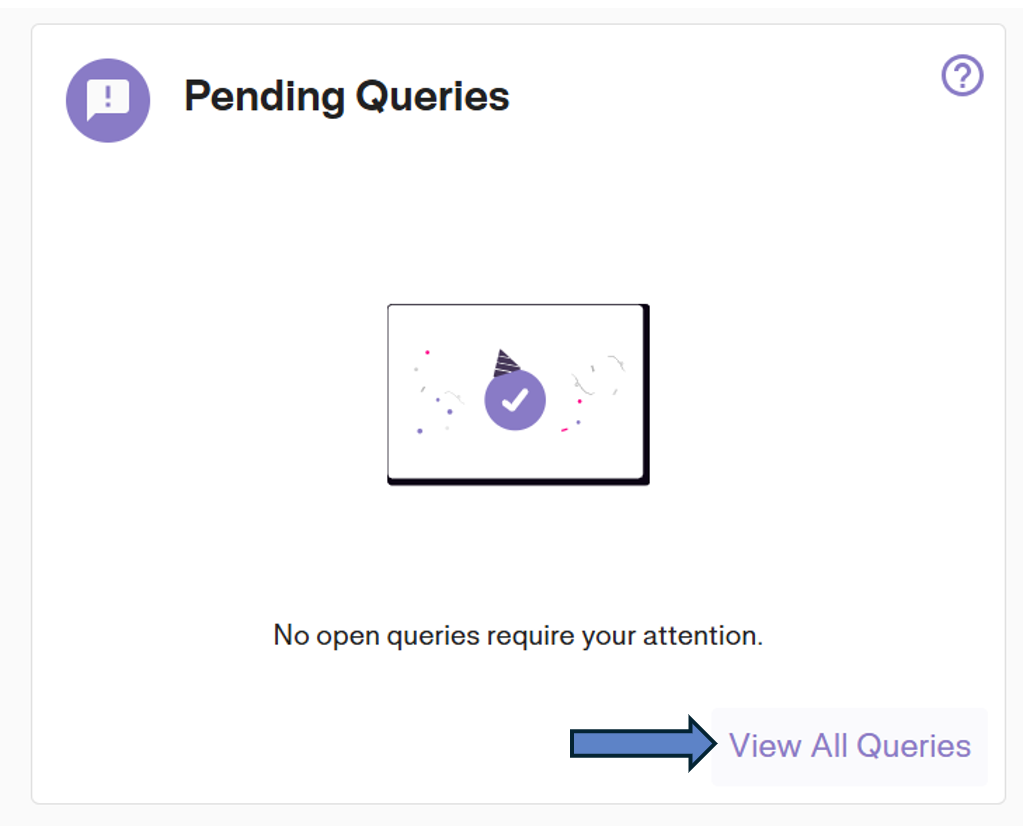
You can track the status of all queries directly from your dashboard using the Pending Queries and Recent Activity widgets.
Global Query List
To see a comprehensive list, click the View All Queries button on the dashboard card.
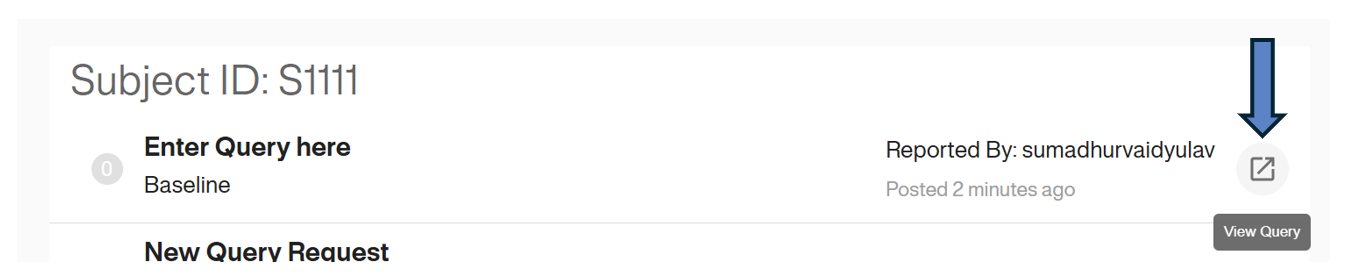
This opens the full query log. To navigate directly to the specific form or visit where the query resides, click the Arrow Icon (View Query) on the right side of the list row.
Resolving a Query
When site staff have corrected the data or provided a satisfactory response: 1. Open the query thread. 2. You can here post another to continue on thread. 3. You can also Notify users involved in the thread 4. Click the Resolve button to close the ticket. The red indicator will disappear.